DevOps Foundations Microservices
GitbookCourses2021-02-22
💡 DevOps Foundations: Microservices
🪕 1. Microservices In Production
-
Decoupling
multiple tech stacks- services are deployed and scaled independently
- implementation and changes are isolated
- Increased cohesion (凝聚): different boundaries
-
Increased development velocity (速度) and diversity (多元化)
- smaller services, smaller teams
- Multiple tech stacks
- Increased operational complexity
- Distributed systems
- Eventual consistency
📑 The 3 common characteristic of well-defined microservices
- Domain-Driven Design
- Loose Coupling, High Cohesion (松耦合,高内聚力)
- Continuous Delivery
🪕 2. Service Readiness
📑 Standardization
- exemplars 范例
- Service Templates: Dropwizard, Governator, Cookiecutter
📑 Unit and integration testing
- Gateway Integration Tests
- Persistence Integration Tests
- Component: In-Process, Out-of-Process Component Tests
📑 End-to-end and contract testing
📑 Contract test
Contract-driven contracts define the expectations of a consumer on a service.
📑 Performance testing: sinon
📑 Continuous integration: git commit
📑 Continuous delivery: Travis CI, Jenkens
In order for continous delivery to be archieved, a build pipeline must create an artifact from source control
📑 Platform-specific and OS artifacts
-
What is the recommended approach for structuring code in a microservices architecture?
Have 1 repository, 1 build pipeline, and 1 artifact per microservice.
- In a microservices architecture, system as a whole should be the focus of performance testing.
📑 Virtual machine and container artifacts: Docker
📑 Versioning: semantic version(^~): major.minor.patch
📑 Basic service discovery
- service registy + basic discovery
-
service discovery with DNS
example of domain-based environments (service_name-environment-organization):
research-performance.bestitconsulting.com
📑 Dynamic service registries
-
2
DiscoveryPatterns:Client-sidediscovery, e.g: Netflix Open-Source ToolsEureka- service registryRibbon- client-side load balancerServer-sidediscovery- Console and Nginx
- Kubernetes
-
2
RegistrationPatterns:Self-registration: heatbeat requestThird-partyregistration
📑 Documentation
- JIRA, sprint story
- Swagger UI: yaml, json, no disquz comments
- gitbook, markdown
📑 Ownership and Conway’s law
🪕 3. Service Resilience, Reliability, and Scalability
📑 Architectural safety measures
📑 Integration methodologies (方法论)
- shared Database
- Synchronous communicatiton
- Asynchronous communicatiton
-
Orchestration vs. Choreography 编排与编舞
- A service collaboration pattern that relies on a
centralbrain to guide and drive business processes - describes a system where each part is told what its job is and lets the part itself work out the details.
- A service collaboration pattern that relies on a
📑 Synchronous integration technologies
- RPC
- REST: Resources, HATEOAS
GraphQL: API standard that combines RPC with the REST concept of resources in order to make API interactions more efficient
📑 Asynchronous integration technologies
- Emit events
- Message Broker: Smart endpoints, dumb pipes
📑 Logging
(A) Log Aggregation Tools: (聚合)
-
ELK Stack: Elasticsearch, Logstash, and Kibana, Beats.
“ELK” is the acronym for three open source projects:
Elasticsearch,Logstash, andKibana.Elasticsearchis a search and analytics engine.Logstashis a server‑side data processing pipeline that ingests data from multiple sources simultaneously, transforms it, and then sends it to a “stash” likeElasticsearch.Kibanalets users visualize data with charts and graphs in Elasticsearch.The
Elastic Stackis the next evolution of the ELK Stack. - Grafana
(B) Standarize log format
(C) Correlation ID (相关性)
A global unique identifier generated and propagated across service calls for a request.
(D) Distributed Tracing Tools
- Zipkin
- Jaeger
📑 Monitoring
(A) Dashboard: metrics
(B) Synthetic (合成的) Monitoring
(C) Metrics Aggregation Tools: Grafana, Graphite, Prometheus
📑 Alerting
- On-Call Rotation
📑 Incidents (事件)
- Assessment
- Coordination
- Mitigation 减轻
- Resolution
- Follow-Up
📑 Services-level Objectives (SLOs) and error budgets
- SLI: initial indicator.
- A specified target level expressing the desired reliability of a service
- 服务级别目标是指服务提供者向客户作出的服務保證的量化指標。例如軟件提供商向客戶保證一年的時間內有 99.95%的時間應用程序不會出現故障,或是一個月以內 75%的撥打的呼叫中心求助电话将在一分钟内得到答复。這就是一種典型的服务级别目标說明。
-
SLOs help determine what engineering work to prioritize:
- Availability
- Latency
- Throughtput
- Correctness
📑 Capacity planing 容量
- The process to determine the hardware needs of a service.
- Aualitative, Quantitative Growth Scale
- Utilize Autoscaling
🪕 4. Microservices by Example
📑 Overview of KinetEco case study
📑 Greenfield services
- created a service template
- used existing CI infrastructure
- created a shared library for CI/CD functionality and shared base images
- Kubernetes
📑 Splitting the monolith
- seams: 接缝
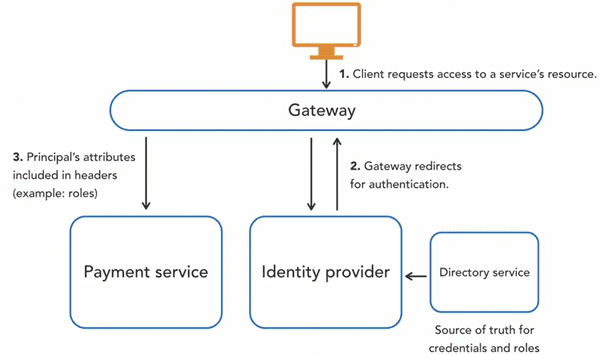
📑 User-facing authentication and aurthorization
📑 Service-to-service authentication antipatterns
- Authentication and Authorization 认证与授权
- Network-based Protection
- Basic Authentication

📑 Service-to-service authentication
- Single Sign-On
- Client Certificates
- HMAC HTTP Request
- API Keys
📑 Challenges adopting microservices
- API Versioning
- Kubernetes
- Reporting
